Mobile Apps - The Game Changer
Mobile Applications are here and now, and they're not going away any time soon!
GENERAL MOBILE APP INDUSTRY STATISTICS
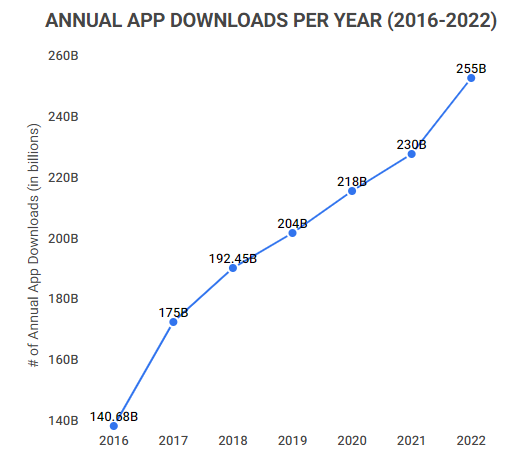
Between 2019-2020, there were over 250 million apps downloaded daily.
That equates to over 91 billion apps downloaded each year, and that number is only expected to increase. By 2024, there could be as many as 500 million apps downloaded every day (184 billion by the end of the year), double that in 2020.
98% of Google Play’s revenue comes from free apps.
While free apps don’t cost anything to download, they’re still a form of marketing and can make money through advertisements. Companies like McDonald’s regularly make gaming apps for children with the sole purpose of marketing their brand. In that way, free apps and advertisements are surprisingly useful for generating revenue.
The global consumer spending on apps reached $129 billion as of 2022.
That is a huge number, but it’s also a slight decrease from the year prior. Consumers spent roughly $133 billion on apps in 2021, meaning that consumer spending has decreased 3% in only one year.
GLOBAL APP REVENUE 2016-2022
| Year | Total App Revenue (in billions USD) | iOS App Revenue | Google Play App Revenue |
|---|---|---|---|
| 2022 | $129 | $86.80 | $42.3 |
| 2021 | $133 | $85.10 | $47.90 |
| 2020 | $111 | $72.30 | $38.60 |
| 2019 | $89 | $58.40 | $30.60 |
| 2018 | $71.30 | $46.60 | $24.80 |
| 2017 | $58.10 | $38.50 | $21.20 |
| 2016 | $43.50 | $28.60 | $15 |
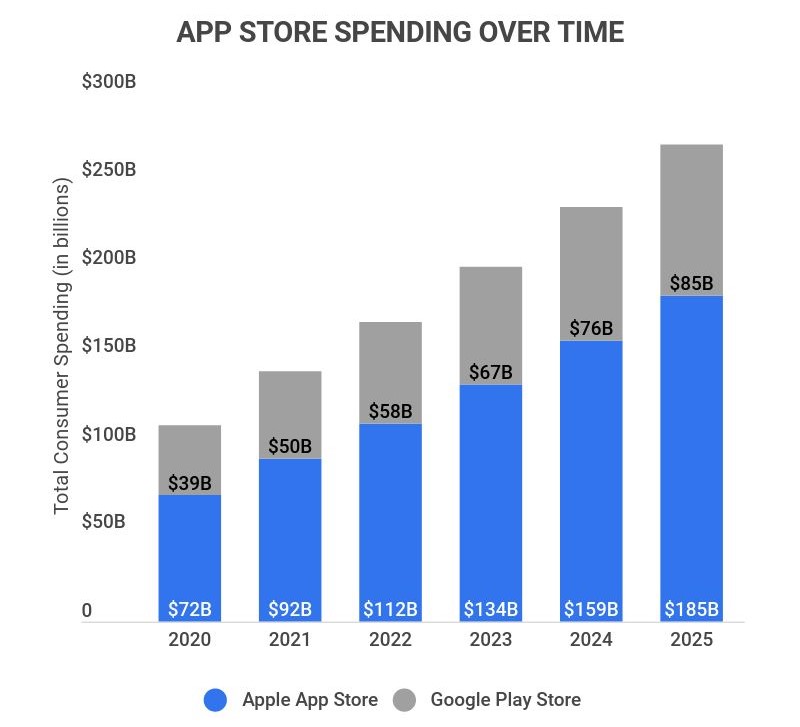
By the end of 2022, consumer app spending is expected to reach $170 billion.
That’s a projected 27.8% increase in consumer spending in 2021. Plus, consumer app spending is expected to grow larger by 2025. By 2025, consumer app spending may reach over $270 billion.
By 2023, mobile apps are projected to generate at least $935 billion in revenue.
For context, the industry generated $462 billion in 2019, meaning that in only 4-5 years, mobile app revenue will more than double. Most of this money will come from advertisements, but paid downloads will also generate a good portion.
MOBILE APP INDUSTRY STATISTICS BY APP USERS
While the mobile app industry reaps the financial benefits of their products, they wouldn’t be able to do so if people didn’t download them. After all, it’s hard to find someone that doesn’t use mobile apps nowadays. Overall, when it comes to mobile app users, our research shows that:
The average user engages with 30 apps per month.
In total, that equates to around two-thirds or more of the apps installed on the average consumer’s phone. Users also typically use at least 9-10 apps per day, therefore creating the 30:10 rule (30 apps in a month, 10 per day).
51% of smartphone users check their apps 1-10 times per day.
While that’s the majority of those surveyed, another 25% of users check their apps 11–20 times per day, 16% check 21-50 times per day, and 7% admit to opening apps more than 51 times every day.
85% of the time spent on smartphones is spent using apps.
However, this time is not divided evenly across all apps. For example, Facebook alone makes up 13% of U.S. minutes spent on apps, and Google follows at 12%. In fact, Google, Facebook, Amazon, and Apple alone account for just over 30% of the time people spend on apps.